
- Log in to the Azure portal at https://portal.azure.com➢ navigate to the Azure Stream Analytics job you created in Exercise 3.17➢ select the Outputs link on the navigation menu ➢ select + Add drop‐down menu ➢ select Power BI from the menu ➢ enter an output sink name (I used powerBI) ➢ select the Select Group (or Select Power BI) workspace from the Your Subscription radio button ➢ select the workspace you created in Exercise 5.12 from the Group Workspace drop‐down list ➢ select User Token from the Authentication Mode drop‐down list box ➢ enter a dataset name (I used brainjammer) ➢ enter a table name (I used brainwaves) ➢ click the Authorize button ➢ and then click Save. The configuration should resemble Figure 7.19.
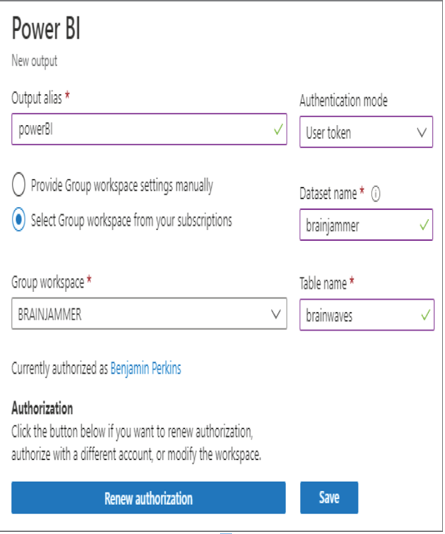
FIGURE 7.19 Power BI Azure Stream Analytics output configuration
- Select the Query link on the navigation menu ➢ enter the query located in StreamAnalyticsQuery.txt file found in the Chapter07/Ch07Ex05 directory on GitHub ➢ click the Save Query button ➢ and then start the Azure Stream Analytics job.
- Download, uncompress, and use the brainjammer.exe file located in the brainjammer.zip file from the Chapter07/Ch07Ex03 directory on GitHub ➢ and then perform the same action as performed in step 6 of Exercise 7.3 (see Figure 7.13), which will create the dataset in Power BI, as shown in Figure 7.20.
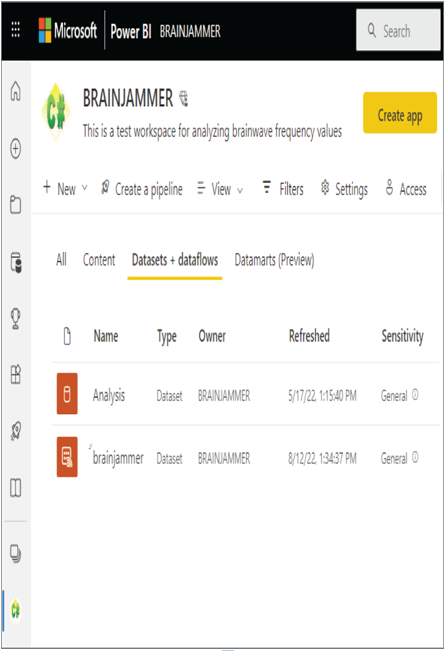
FIGURE 7.20 The brainjammer streaming dataset in Power BI
- Log in to the Power BI workspace you created in Exercise 5.12➢ click the + New drop‐down menu ➢ select Dashboard (Build a Single‐page Data Story) ➢ enter a dashboard name (I used BRAINWAVES) ➢ click the Create button ➢ select the Edit drop‐down menu ➢ select the + Add a Tile menu option ➢ select the Custom Streaming Data tile in the REAL‐TIME DATA section, as shown in Figure 7.21➢ and then click Next.
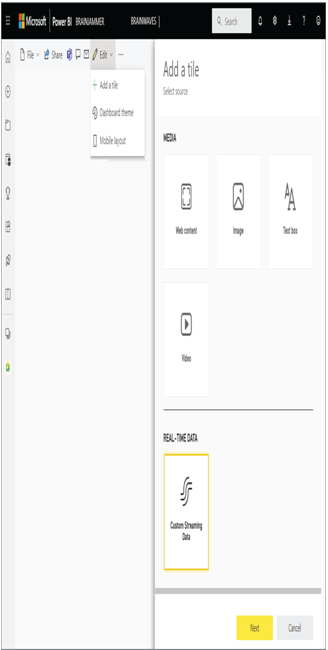
FIGURE 7.21 Adding a real‐time data tile to the Power BI dashboard
- Select the dataset you configured in Azure Stream Analytics in step 1 of this exercise, shown previously in Figure 7.20 (for example, brainjammer) ➢ click Next ➢ select Clustered Bar Chart from the Visualization Type drop‐down list box ➢ select Scenario from the Axis drop‐down list box ➢ select each of the values from the Values drop‐down list box, as shown in Figure 7.22➢ configure the Time Window to Display setting to 5 seconds.
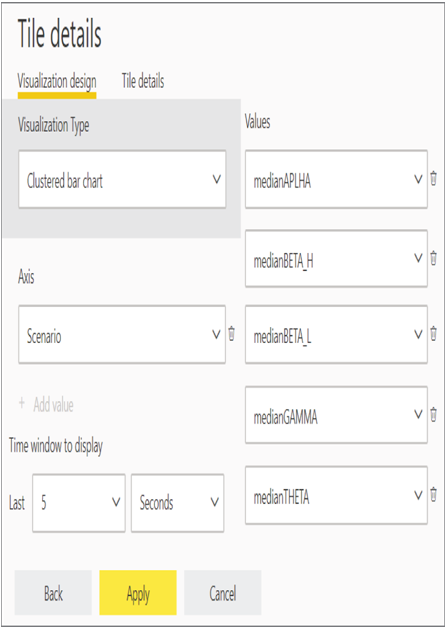
FIGURE 7.22 Configuring a real‐time data tile to the Power BI dashboard
- Click the Next button ➢ enter a title (I used Brainwaves) ➢ enter a subtitle (I used Real‐time brainwaves from the brainjammer) ➢ and then click Apply.
- Perform the same actions you performed in step 6 of Exercise 7.3 (see Figure 7.13) and in step 3 in this exercise, and then view the real‐time brain wave stream flowing into the Power BI dashboard that you created in step 4 and 5 of this exercise, which should resemble Figure 7.23.
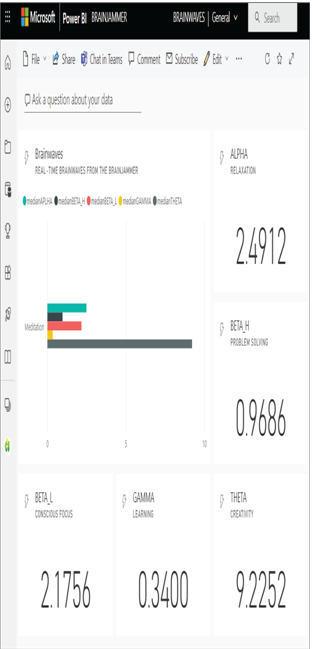
FIGURE 7.23 Viewing a real‐time data tile to the Power BI dashboard
- Stop the Azure Stream Analytics job.