The final topic that can influence your decision toward a specific streaming product has to do with price. Table 7.4 describes how each product accrues costs. Each SU allocated to an Azure Stream Analytics job carries a cost. It is important to know the number of partition keys, which then influences the number of SUs. If you have 10 partition keys, you can get 10 SUs, which renders a change of 10 times the amount of a single SU per hour.
TABLE 7.4 Azure streaming products’ pricing units
| Product | Pricing unit |
| Azure Stream Analytics | Streaming units per hour |
| Azure Databricks | Databricks units |
| HDInsight with Spark Streaming | Per cluster hour |
| HDInsight 3.6 with Storm | Per cluster hour |
| Azure Functions | Per function invocation |
| Azure WebJobs | Per app service hour |
A Databrick Unit (DBU) is similar to a SU in that it represents the consumed CPU and memory over a given time period—in this case, an hour. For HDInsight, you may have noticed that the cost is estimated during its provisioning. Depending on the size and number of nodes, the cost is calculated per hour of consumption. An Azure function is charged based on the number of times it is executed, which makes it very cost effective. Azure WebJobs are charged in the same way as an Azure App Service, in that it depends on the size of the VM on which the Azure WebJob is placed, and are charged by the hour of consumption. There is no charge when the Azure WebJob is not running. Finding the most optimal cost for running your data analytics workloads is a very important factor when choosing not only an Azure streaming product, but any product you will use on the Azure platform.
Lambda Architecture
The last remaining layer of the lambda architecture to be covered in this book is the speed layer. Figure 3.13 illustrates all three lambda architecture layers. The serving layer was introduced in Chapter 3 and implemented in Chapter 4, “The Storage of Data.” In Chapter 6, “Create and Manage Batch Processing and Pipelines,” you implemented the batch layer, which completed the Data Flow through the cold path. The speed layer is the layer that ingests and transforms data through the hot path and most commonly is ingested using a streaming solution. The speed layer typically receives data generated by IoT devices sent through some kind of message ingestion endpoint. Those endpoints are, for example, Event Hubs, IoT Hub, or Kafka. Then any of the products described in Table 7.1 and 7.2 can be used to perform transformation to the streamed data. As shown in Figure 3.13, the output of the streaming product (such as Power BI) can be transmitted in real time to a consumer for visualization. The streamed data can also be placed on the serving layer for near real‐time consumption. A summarized illustration of this is shown in Figure 7.7.
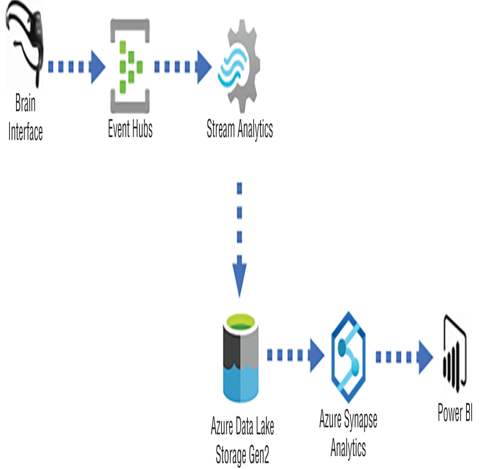
FIGURE 7.7 Lambda architecture speed layer, near real‐time processing
Figure 7.7 illustrates data being streamed from a BCI to an Event Hubs namespace. The data stream is then ingested by an Azure Stream Analytics job, transformed, and stored on an ADLS container. Additional transformations can be performed via an Azure Synapse Analytics pipeline to add any late arriving data, perform upserts, and find additional business insights. Once the pipeline runs, the data can then be consumed and visualized, for example, by Power BI. Complete Exercise 7.1, where you will configure Azure Stream Analytics to store a data stream on an ADLS container.