Imagine that you have a real‐time streaming solution that receives the same data more than once. In the brain wave reading scenario, this might not be very significant, but in some other scenarios, it could be. For example, in financial transactions, medical patient conditions, or airplane altitudes, receiving data more than once could have serious consequences. There are three concepts relevant in the event delivery context:
- Exactly once delivery
- Exactly once processing
- Duplicate records
The concepts are relatively self‐explanatory. A guaranteed one‐time delivery of an event means that the event is passed to the output sink once and only once. Azure Stream Analytics guarantees delivery at least once, which means that the output sink could conceivably receive the same event more than once. If the possibility of receiving a duplicate event is an issue for your solution, then there are some methods you can implement on the output sink. For example, if the sink supports upserts, or if the stream contains a primary key that is then enforced on the sink, then if Azure Stream Analytics sends the same event more than once, it can be managed at the destination. The second concept is a guarantee that the event is processed only once. Azure Stream Analytics does guarantee exactly once processing, which means that multiple events sent to an input will always return the same result. This is important in the event of a restart, which could result in the input receiving a duplicate event. You would expect the same result both times when the same event is processed. If the same event is processed more than once in the same transaction, the value would not be the same as if it had been processed only once.
There are a few scenarios in which an event would be duplicated, such as platform upgrades, a platform outage, or when the Azure Stream Analytics job is started using the When Last Stopped option, as shown in Figure 7.18.
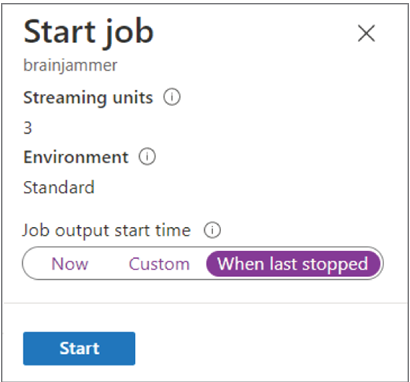
FIGURE 7.18 Use reference data with Azure Stream Analytics.
Platform upgrades like operating system, source code libraries, or product upgrades happen. In many scenarios the administrator of the Azure subscription is sent an email about this activity. The action you take in this scenario depends on the criticality of the data being streamed to your company. Although very rare, outages do happen. When they do, you need to determine the impact and take action, which could be anything from creating a support case with Microsoft to implementing your company’s BDR process. When you start an Azure Stream Analytics job, you most likely start it with the Now option. But, as shown in Figure 7.18, there are two other options: Custom and When Last Stopped. Starting the job using the Now option means the starting point of the output stream is the current date and time. When the Azure Stream Analytics job is not running, it does not mean that the data producers have also stopped sending data to the inputs. In the exercises you have configured a temporal operator to manage the data the query is executed on. The temporal operator is a 5‐second tumbling window. When the Now option is chosen, Azure Stream Analytics will look back 5 seconds into the input, process that data, and send it to the output. If the tumbling window were set to 5 minutes, then the look‐back time frame would be 5 minutes. Setting the option to Custom means you can set the start time yourself. The behavior is the same as with Now, in that if you are using a temporal operator, Azure Stream Analytics will seek data from the time frame equal to or greater than the current time frame. If your job was stopped manually or failed and you want to restart it, then choose the When Last Stopped option. When you select this option, the last time the data was sent to the output sink is used to identify the data that needs to be included at start up.
Power BI
Looking through a dataset that contains text, even if it is business‐ or gold‐quality data, is not optimal, especially when you are attempting to gather predictive insights. In such scenarios, and when viewing data in real time, a graphical representation of the data helps you to gain a better understanding of the data’s meaning. Numerous tools are available for viewing a graphical visualization of data. For example, Microsoft Excel is a widely used spreadsheet, but it also has some useful data visualization features. However, if you need enterprise‐level data visualization, the tool you should choose is Power BI. In Exercise 7.5 you will stream brainjammer brain waves to a Power BI dashboard that displays the scenario they belong to.